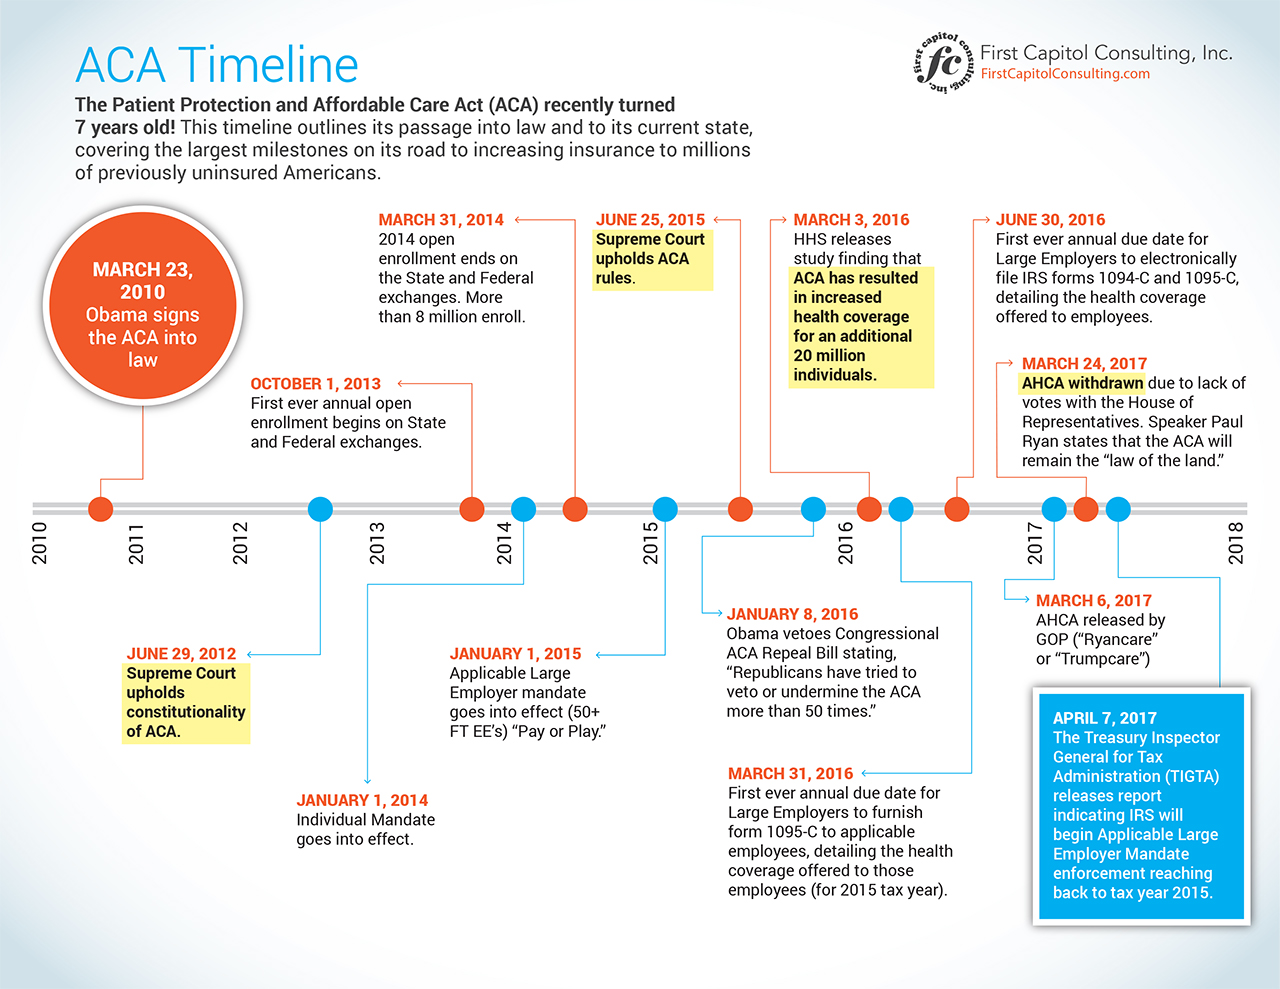
It’s hard to believe that the Affordable Care Act has been the law of the land for over seven years. Just a month ago the ACA’s demise seemed inevitable according to Republicans, who controlled the White House and both houses of Congress. Add to that the seven years of growing pains, the ACA is still here and appears poised to remain the law of the land, helping those receive affordable healthcare that they may have never received before.
In this infographic, we delve into the ACA’s history from an employer perspective. From President Obama’s signing to the implementation of the mandates. There are points of the battles with Congress, along with form filings and the end of Trump’s proposed AHCA. It’s a complex history, despite not yet reaching a decade, though it’s a testament to former President Obama’s vision and his willingness to put it into action. Viewing its history in one timeline shows how far it has come.


